TradingView Screeners are advanced, interactive tools on the TradingView platform, designed specifically for the financial markets. 📈
They enable traders and investors to scan and analyze real-time ⌛ data across various markets including stocks, forex, and cryptocurrencies.
The primary purpose is to streamline the process of identifying potential trading or investment opportunities by filtering through a multitude of financial instruments based on user-defined criteria. 🤑
⭐ Types of Screeners Available
TradingView offers a range of screeners designed to cater to different markets and investment strategies. Here’s an overview of the main types of screeners available on the platform:
Stock Screener
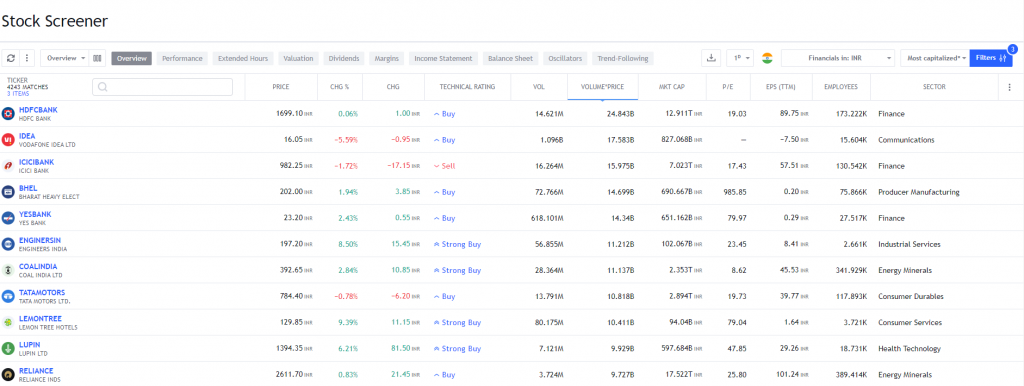
📍 Purpose: Designed for equity markets, the Stock Screener helps traders and investors filter and analyze stocks based on various criteria.
📍 Features: Users can filter stocks based on numerous parameters like market capitalization, price, volume, sector, earnings per share (EPS), price-to-earnings (P/E) ratio, dividend yield, and more. It also includes technical indicators such as moving averages, RSI, MACD, and others for more nuanced analysis.
📍 Use Case: Ideal for identifying stocks that meet specific financial or technical criteria, whether for short-term trading or long-term investing.
📌 Filters
- Performance:
- This category includes filters related to the stock’s performance over various time frames, such as day, week, month, or year. Users can sort stocks based on how they have performed in the recent past, which is useful for identifying trends or stocks that are outperforming or underperforming in the market.
- Extended Hours:
- TradingView’s screener allows users to view stock movements outside of regular trading hours. This is particularly useful as it captures the stock’s performance in pre-market and after-hours trading, which can be indicative of how the stock might perform in the next trading session.
- Valuation:
- This section includes metrics that help assess a stock’s value, like Price/Earnings (P/E) ratio, Price/Sales (P/S) ratio, Price/Book (P/B) ratio, and enterprise value. These metrics are crucial for fundamental analysis, helping investors determine whether a stock is overvalued or undervalued compared to its peers or historical values.
- Dividends:
- Filters in this category focus on dividend-related metrics such as dividend yield, dividend rate, and payout ratio. This is particularly useful for income investors who prioritize stocks that provide steady dividend income.
- Margins:
- This includes filters related to a company’s profitability, such as profit margins, operating margin, and gross margin. Higher margins often indicate a company’s efficiency in converting sales into actual profit, an important factor for long-term investment considerations.
- Income Statement:
- Filters under this category are based on key figures from the company’s income statement like revenue, net income, earnings per share (EPS), and revenue growth. These figures give insights into a company’s financial performance and growth over time.
- Balance Sheet:
- This section includes filters related to the company’s balance sheet, such as total assets, total liabilities, debt-to-equity ratio, and current ratio. These metrics are vital for assessing a company’s financial health and stability.
- Oscillators:
- These are technical indicators that help in identifying the momentum, trend strength, or potential reversal points in a stock’s price. Common oscillators include the Relative Strength Index (RSI), Stochastic, and Moving Average Convergence Divergence (MACD). They are particularly useful for short-term traders.
- Trend-Following:
- This category includes technical indicators that help in identifying and following the market trend. Indicators like moving averages (simple and exponential), Average Directional Index (ADX), and Bollinger Bands are used. These are crucial for traders who base their strategies on trend movements.
Forex Screener
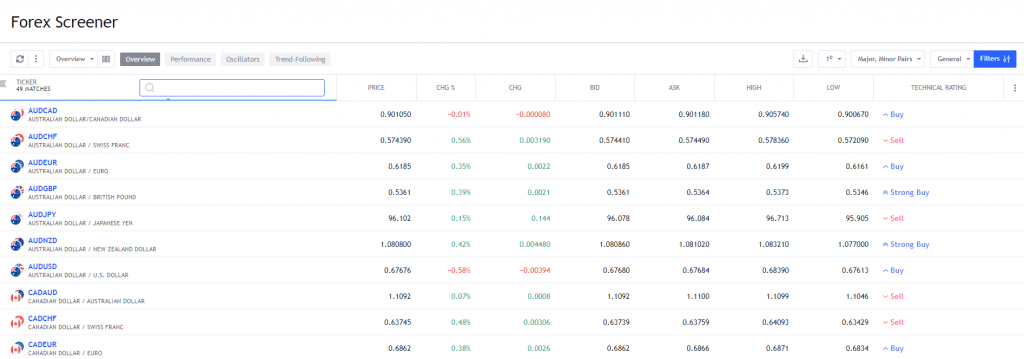
📍 Purpose: This screener is tailored for the foreign exchange market, allowing users to analyze currency pairs.
📍 Features: It includes filters based on price changes, volatility, technical indicators, and patterns. Users can also view performance metrics like percentage change, high/low movements, and technical ratings.
📍 Use Case: Particularly useful for forex traders looking to spot trends, potential breakouts, or retracements in currency pairs.
Crypto Screener
📍 Purpose: Designed for the cryptocurrency market, this screener assists users in navigating the dynamic and volatile world of digital currencies.
📍 Features: Filters include performance metrics, price volatility, market capitalization, trading volume, circulating supply, and various technical indicators.
📍 Use Case: It’s beneficial for crypto traders and investors looking to analyze and identify trends or potential investment opportunities in cryptocurrencies.
ETF Screener
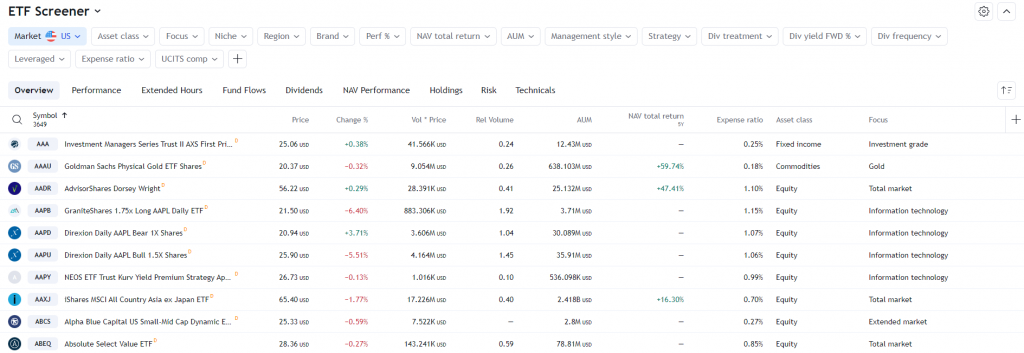
📍 Purpose: Aimed at those interested in trading or investing in Exchange-Traded Funds (ETFs).
📍 Features: Similar to the stock screener, it allows filtering based on performance metrics, sector allocation, expense ratios, and other fundamental and technical criteria.
📍 Use Case: Useful for investors seeking diversified exposure in various sectors or asset classes through ETFs.
Each screener on TradingView is equipped with real-time data, customizable filters, and interactive features, making them a potent tool for market analysis and decision-making. Users can combine these screeners with TradingView’s charting tools and community insights for a comprehensive trading and investing approach.
🗝️ Key Features
📍 Customizable Filters
One of the standout features is the ability to create highly customized filters. This customization extends to both technical and fundamental aspects, allowing users to align the screener with their unique trading strategies.
📍 Real-Time Data
TradingView Screeners offer real-time data updates. This feature is crucial in fast-moving markets, allowing traders to make timely decisions based on the most current market data.
📍 Technical and Fundamental Analysis Tools
The platform offers a blend of both technical indicators (like moving averages, RSI, MACD) and fundamental metrics (like earnings per share, and debt-to-equity ratio), providing a holistic approach to market analysis.
📍 Alerts
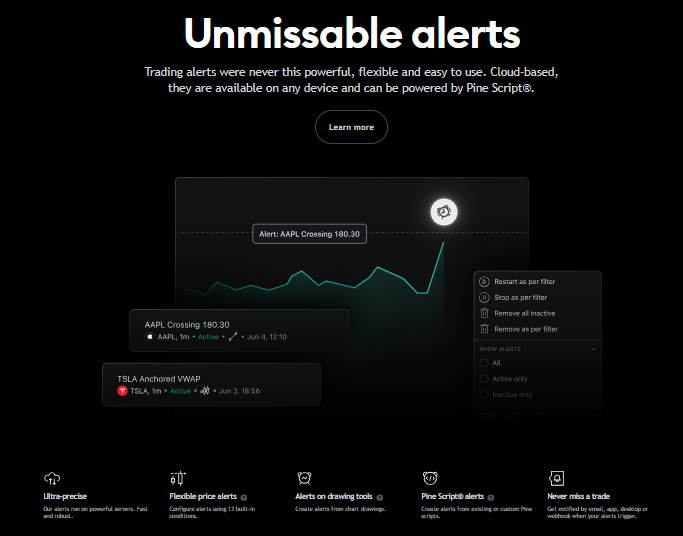
Users can set up customizable alerts that notify them when certain conditions or criteria are met, ensuring they don’t miss potential trading opportunities.
📌 How to Use TradingView Screeners

📍 Selecting a Screener
First, users need to choose the appropriate screener based on their market of interest – stocks, forex, or cryptocurrencies.
📍 Setting Filters
Users can then set up and adjust various filters according to their investment or trading strategy. This could include technical indicators, financial metrics, or even specific price patterns.
📍 Analyzing Results
The screener processes the chosen criteria and displays a list of financial instruments that match. This list can be sorted and analyzed further to identify the best opportunities.
📍 Saving and Sharing Screeners
Users have the option to save their customized screener settings for future use and can also share these settings with the TradingView community, fostering a collaborative environment.
🪽 Tips for Effective Use
📍 Clearly Define Your Investment or Trading Goals
Before using a screener, it’s essential to have a clear understanding of your investment or trading objectives. Are you looking for short-term trading opportunities, or are you more interested in long-term investments? Depending on your goals, the criteria you set in the screener will vary. For instance, if you’re interested in day trading, you might focus on high volatility and trading volume, whereas for long-term investments, you might prioritize factors like company fundamentals and historical performance.
📍 Master the Art of Setting Filters
The effectiveness of TradingView Screeners largely depends on how well you set your filters. Take time to understand and experiment with different filter options. For technical analysis, learn about various indicators like moving averages, RSI, and Bollinger Bands. For fundamental analysis, get familiar with metrics like P/E ratio, dividend yield, and earnings growth. The key is to find a combination of filters that aligns with your trading style and market analysis strategy.
📍 Stay Updated with Market Trends and Adjust Accordingly
The financial markets are dynamic and constantly changing. What works today may not be effective tomorrow. Regularly update your screener settings to adapt to current market conditions. For example, during a market downturn, you might want to adjust your screeners to find stocks that are likely to be resilient or undervalued.
📍 Combine Screeners with Other Analysis Tools
While screeners are powerful, they are best used in conjunction with other tools and resources. Use screeners to narrow down potential opportunities, but dive deeper with detailed chart analysis, news updates, and fundamental research before making any trading decisions. This multi-tool approach can provide a more comprehensive view of potential investments.
Pros And Cons
👍 Pros
- Time-Saving and Efficiency: Screeners significantly reduce the time and effort needed to analyze large sets of data, making the process more efficient.
- Customization and Flexibility: The ability to customize screeners means they can be tailored to a wide range of trading styles and strategies.
- Wide Market Coverage: The screeners cover a broad spectrum of markets, offering versatility to users with diverse market interests.
👎 Cons
- Learning Curve for Beginners: New users may find the array of options and data intimidating, requiring a period of learning and adaptation.
- Not a Silver Bullet: While screeners are powerful tools, they are not foolproof and should be used as part of a larger trading or investment strategy.
🔥 Bottom Line
TradingView Screeners is a cornerstone for financial market analysis, offering a fusion of customizable, real-time data screening across various markets, including stocks, forex, and cryptocurrencies. Their strength lies in empowering traders and investors with the tools to make more informed decisions, effectively saving time and enhancing the potential for successful strategies.
These screeners provide a level of adaptability and depth that is essential in today’s fast-paced financial environments. They are equipped with advanced filtering capabilities, allowing users to sift through a multitude of data points.
This enables precise targeting of market opportunities that align with individual trading styles and objectives. Whether one is a short-term day trader looking for volatility and quick gains, or a long-term investor focusing on fundamentals and steady growth, TradingView Screeners offers the versatility and analytical depth to cater to a wide range of investment strategies.
This powerful tool is a valuable asset in any trader’s arsenal, offering insights and analysis that can lead to more thoughtful, data-driven investment decisions.